-
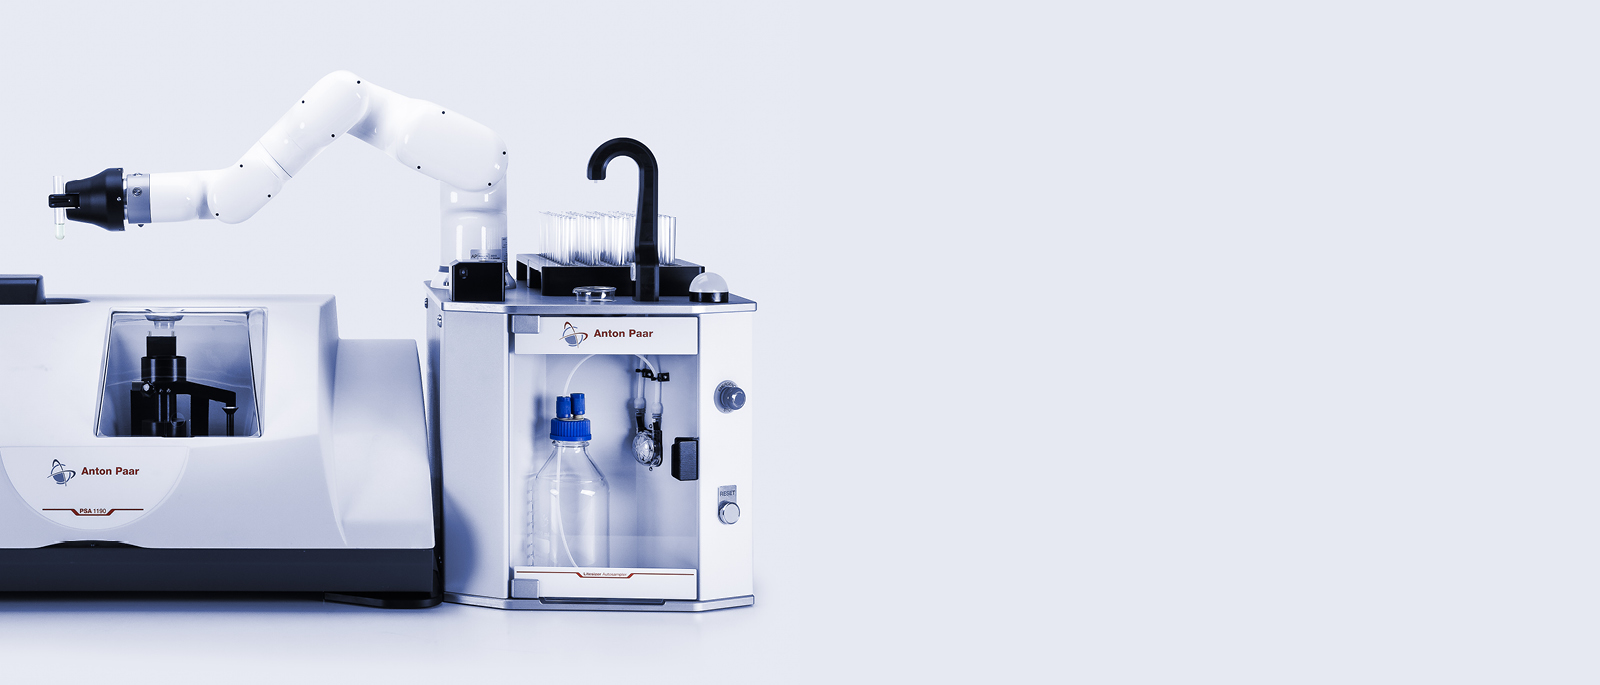
New Autosampler for Particle Analysis
Buy yourself some free time with the new Litesizer Autosampler for the PSA series that measures up to 60 liquid and dry samples in the same run.
Learn more -
Meet us at ACHEMA 2024 in Frankfurt
Visit our booth to discover the very latest in process-industry innovation, including our portfolio for flow-, concentration- and viscosity measurement, as well as our process engineering solutions.
Learn more -
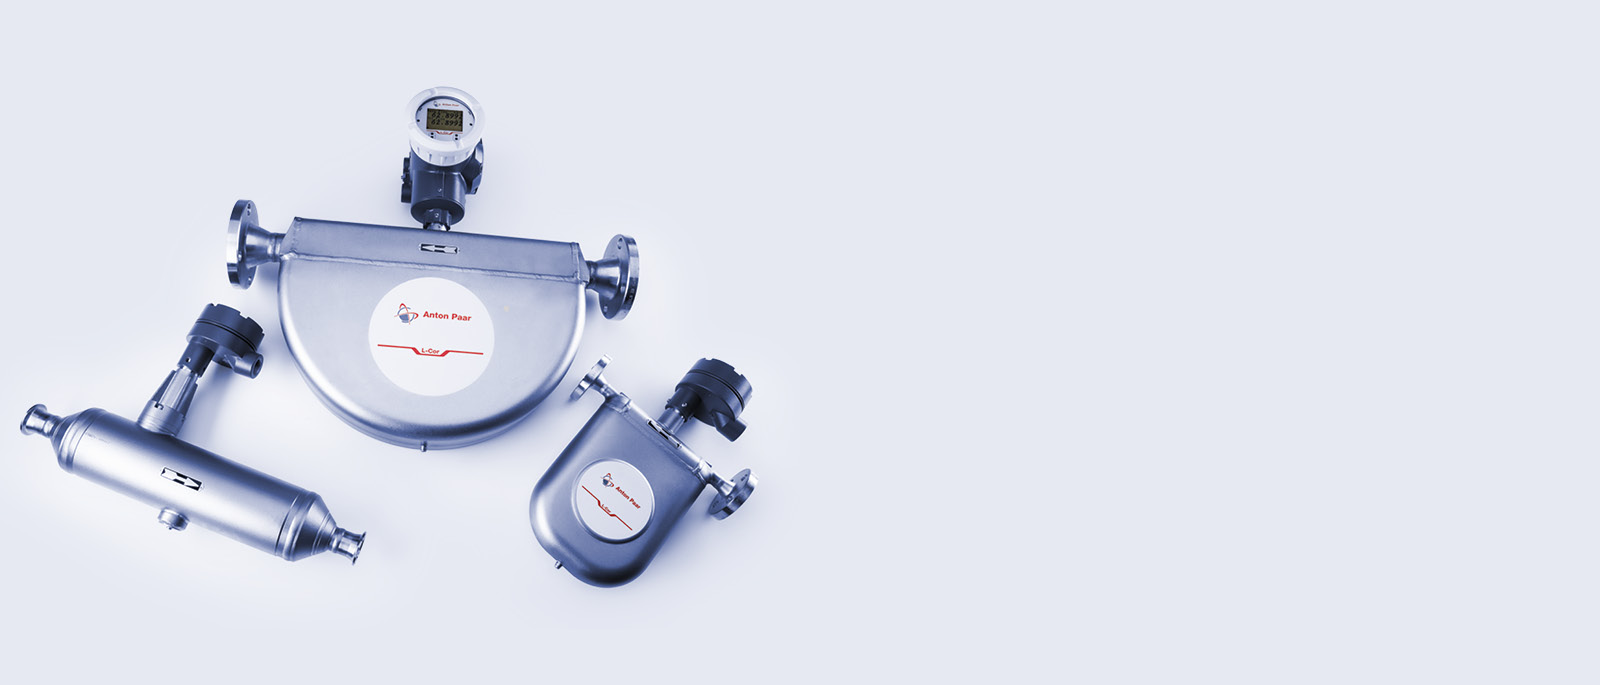
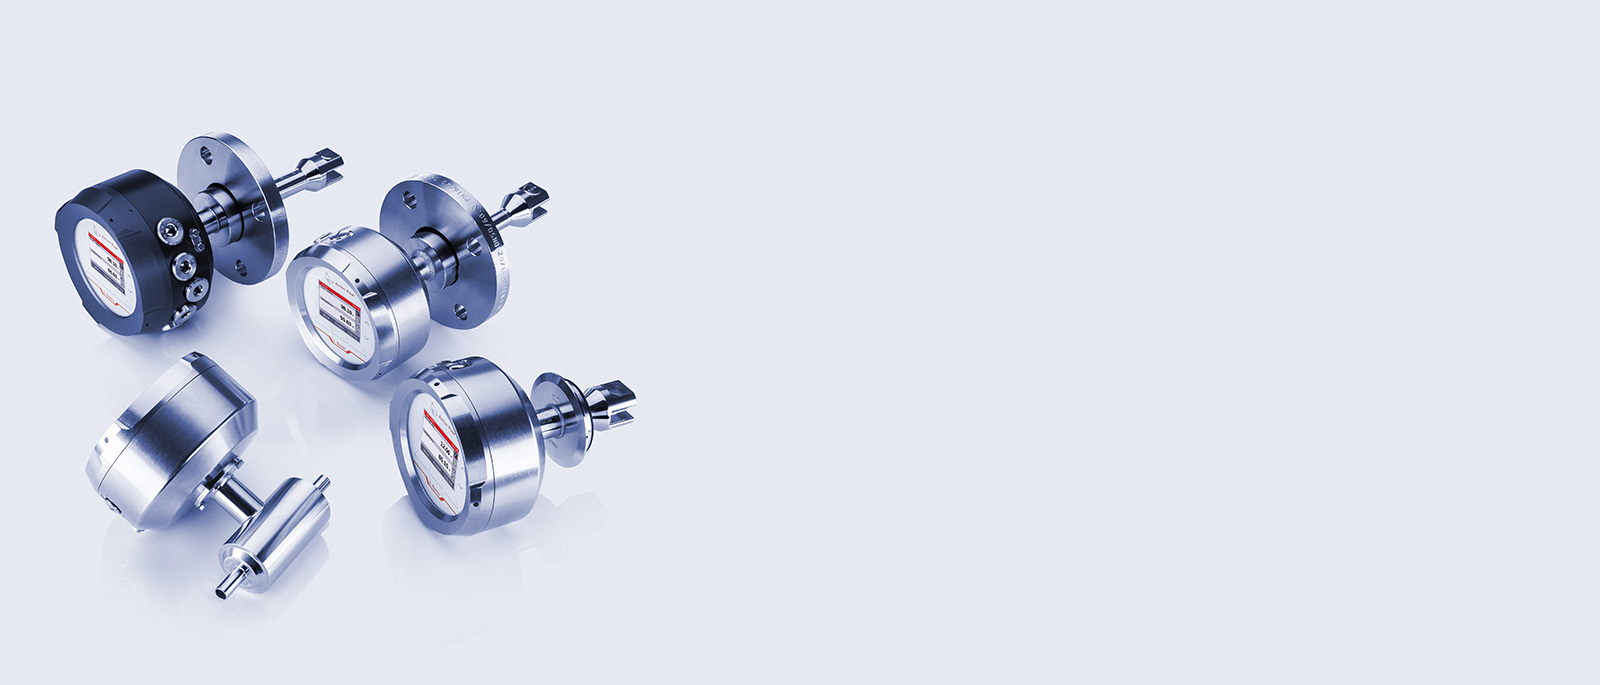
Flow with Anton Paar
With our new Coriolis meters, we’re now a one-stop-shop for your inline measurements. The multiparameter measurement, including mass flow, density, and concentration, provides in-depth analysis of your process.
Find out more -

International XRD Symposium 2024
Hosted by the Graz University of Technology and Anton Paar in the Austrian city of Graz, we’ll be discussing the latest advances and research in the field of powder XRD. Event date: July 9 to July 11, 2024.
Learn more -

Say Hello to Our New Subsidiaries: Anton Paar Vietnam and Anton Paar Peru
Starting on January 1, 2024, we´re excited to be able to offer closer support and customer service at our new locations.
Find out more


Laboratory Instrumentation
Anton Paar has a long history of providing high-end laboratory instruments: density meters, refractometers, polarimeters, instruments for sample preparation and synthesis, viscometers, rheometers, and instruments for material characterization.
Process Instrumentation
Anton Paar has your solution for inline production monitoring: The portfolio covers density and concentration sensors, inline refractometers, process viscometers and sensors for measuring dissolved CO₂.
Automation & Robotics
Anton Paar designs custom-tailored automation solutions from the first idea to final production: sample changers for automating single devices, robotically operated rheometers and a platform which automates multiple instruments.
News from the Anton Paar Group

About Anton Paar
Anton Paar develops, produces and distributes highly accurate laboratory instruments and process measuring systems, and provides custom-tailored automation and robotic solutions. It is the world leader in the measurement of density, concentration and CO2 and in the field of rheometry. Anton Paar GmbH is owned by the charitable Santner Foundation.
Over 4400 employees at the headquarters in Graz and the 37 sales subsidiaries worldwide ensure that Anton Paar products live up to their excellent reputation. The core competence of Anton Paar – high-precision production – and close contact to the scientific community form the basis for the quality of Anton Paar’s instruments. Read more
Anton Paar GmbH – Headquarter
Anton Paar Strasse 20
8054 GRAZ
AUSTRIA
Tel.
+43 316 257 0
Fax
+43 316 257 257
info[at]anton-paar.com
Opening hours
Monday to Friday: 07:00AM - 05:00PM